PSMProject Site Map Request a demo
Utility-scale solar, from first pile to O&M

One map for the whole life of a solar plant.

PSM puts construction progress, live production, maintenance, safety and drone inspections on one site map that every person on site carries on their phone. Priced by site size, never by user. Unlimited users.

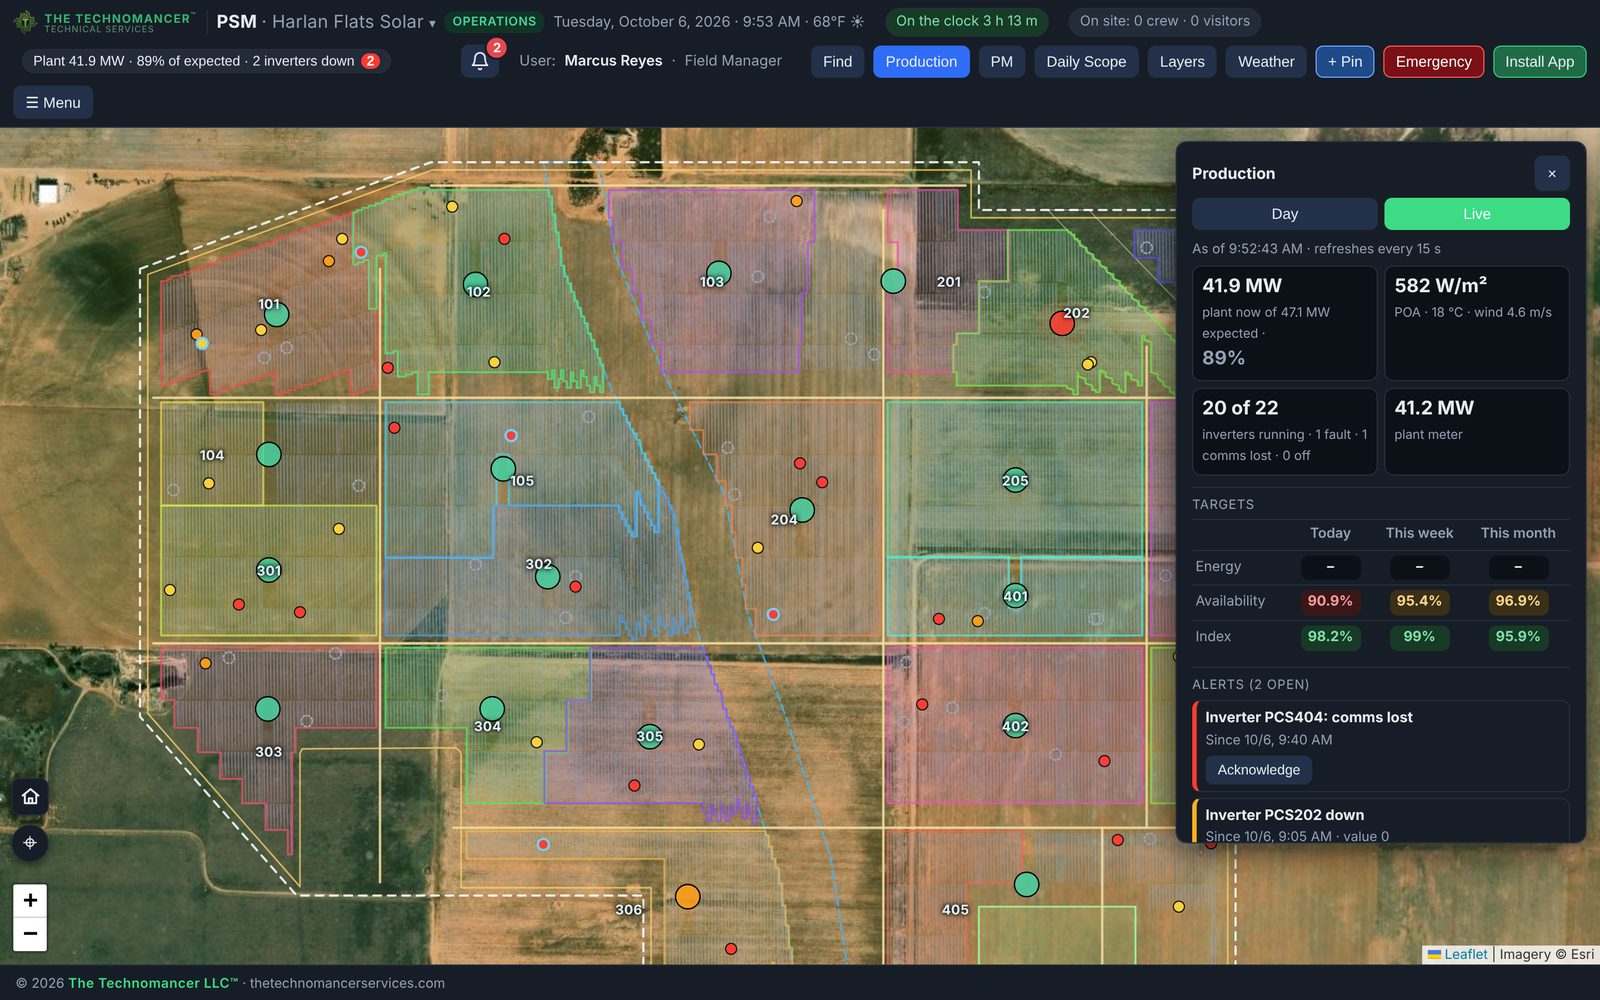
PSM live production panel over an operating 100 MWac plant, with plant output against expected, inverter status, availability targets and open alerts
Unlimited usersOwners, EPC crews, O&M techs, subs and inspectors, with no per-seat cost
Build and operateThe construction record becomes the plant's operating map at COD
Safety on every screenEmergency, SOS, weather limits, permits and PPE by equipment
Works offlineKeeps working with no signal and syncs when coverage returns

Designed by a journeyman electrician and former utility-scale plant manager, and in daily use on an active 100 MWac solar build.

What PSM does for each team

Everyone works from the same map, but each team gets the tools and the answers it needs from it.

Owners and asset managers

See the plant yourself, without waiting for a report

  • Live production against expected, availability and performance index, today, this week and this month (Ops + SCADA plan).
  • Construction progress by activity during the build, straight from the contractor's own daily report.
  • A read-only owner view with crew on site, active permits, weather, daily reports and every SolarEye drone thermal scan.
  • Approve change orders and submittals as a named step, with a record of who approved what and when.

Value: fewer surprises, faster decisions, and one record you can hand to lenders, insurers and the next owner.
EPC and construction

Turn the plan of the day into work you can prove

  • Plan of the day on the map, uploaded from the daily report PDF, with plan vs. done checked automatically.
  • Required photos named, placed and counted per task, so the turnover photo log is already sorted by place and activity.
  • QA inspections and punch on the equipment, assigned, fixed with a photo and verified.
  • RFIs, submittals, change orders and minutes tied to the block or run they're about.

Value: slips caught the same day, cleaner closeout, and a turnover that doesn't take a month of chasing photos.

O&M providers

Find the fault, send the right tech, prove the fix

  • Live SCADA on the map: plant output, inverter health colors and alerts that reach the right people.
  • Fault reports and a troubleshooting guide that lists probable causes and the checks to run, from the manufacturer's data.
  • Preventive maintenance and Daily Scope for every tech, with PPE requirements for the exact equipment they're opening.
  • SolarEye drone scans that turn thermal faults into work orders, and confirm the repair on the next flight.

Value: less downtime, fewer return trips, and availability numbers you can stand behind in a contract review.

Safety teams

The safety program in every hand, not in a binder

  • Emergency and SOS with GPS, nearest hospitals, the ambulance meeting point and everyone on site.
  • Lightning, heat and crane wind limits watched live, with stop-work banners on every phone.
  • Permits and JHAs signed on with a tap, with Site Manager approval for energized and hot work.
  • PPE by equipment from your arc flash study, shown before anyone opens a door.

Value: faster response when it matters, documented compliance, and fewer near misses that start with "I didn't know."

Inspectors, QA and commissioning

Every check stamped, placed and accounted for

  • Inspection forms uploaded from Excel and filled in at the skid, run or block, with torque and test values.
  • Every answer stamped with who, when and where. A fail becomes a punch item automatically.
  • Commissioning thermal scans that put install defects on the punch list before COD.
  • Current drawings one tap away, with a warning when work was built to an older revision.

Value: a defensible QA record and a plant that starts its life with a clean baseline.

Site and project managers

Crew, hours and paperwork in one place

  • Time clock with GPS punches, overtime rules, PTO and approvals, and a payroll export.
  • Who's on site right now, crew and visitors, from the time clock and the gate QR check-in.
  • Daily report PDF built from the day's work, sent in two taps.
  • A "Waiting on you" list of every RFI, approval and action item that needs your answer.

Value: the daily report, timesheets and status updates come straight from the day's records, with no retyping at 6 p.m.

How it works

Set up once from the drawings and data you already have. After that, the team's normal day keeps the map current.

STEP 1

Load the site

Site Setup reads your layout KMZ, an equipment list and your drawing PDFs: blocks, tracker rows, inverter skids, cabinets, MV routes, roads, fence, laydown and substation. It also finds the nearest hospitals for the Emergency panel.

STEP 2

Connect your data

During the build, anyone uploads the contractor's daily report PDF. After COD, SCADA feeds the map live. PM plans, inspection forms and your arc flash study come in from Excel.

STEP 3

Work from the map

Crews and techs tick off tasks, take required photos, run inspections and PMs, and sign permits on the phone. Every record carries a name, a time and a place.

STEP 4

Reports build themselves

Progress, production, plan vs. done, the daily report PDF and the owner view all come from what actually happened that day.

Safety first

The safety tools are on the map, not in a binder

Under construction or in operation, a solar site has miles of open trench, energized equipment, cranes and weather that turns fast. PSM puts the emergency plan, live weather hazards, permits, PPE and the headcount on the screen the crew already uses all day.

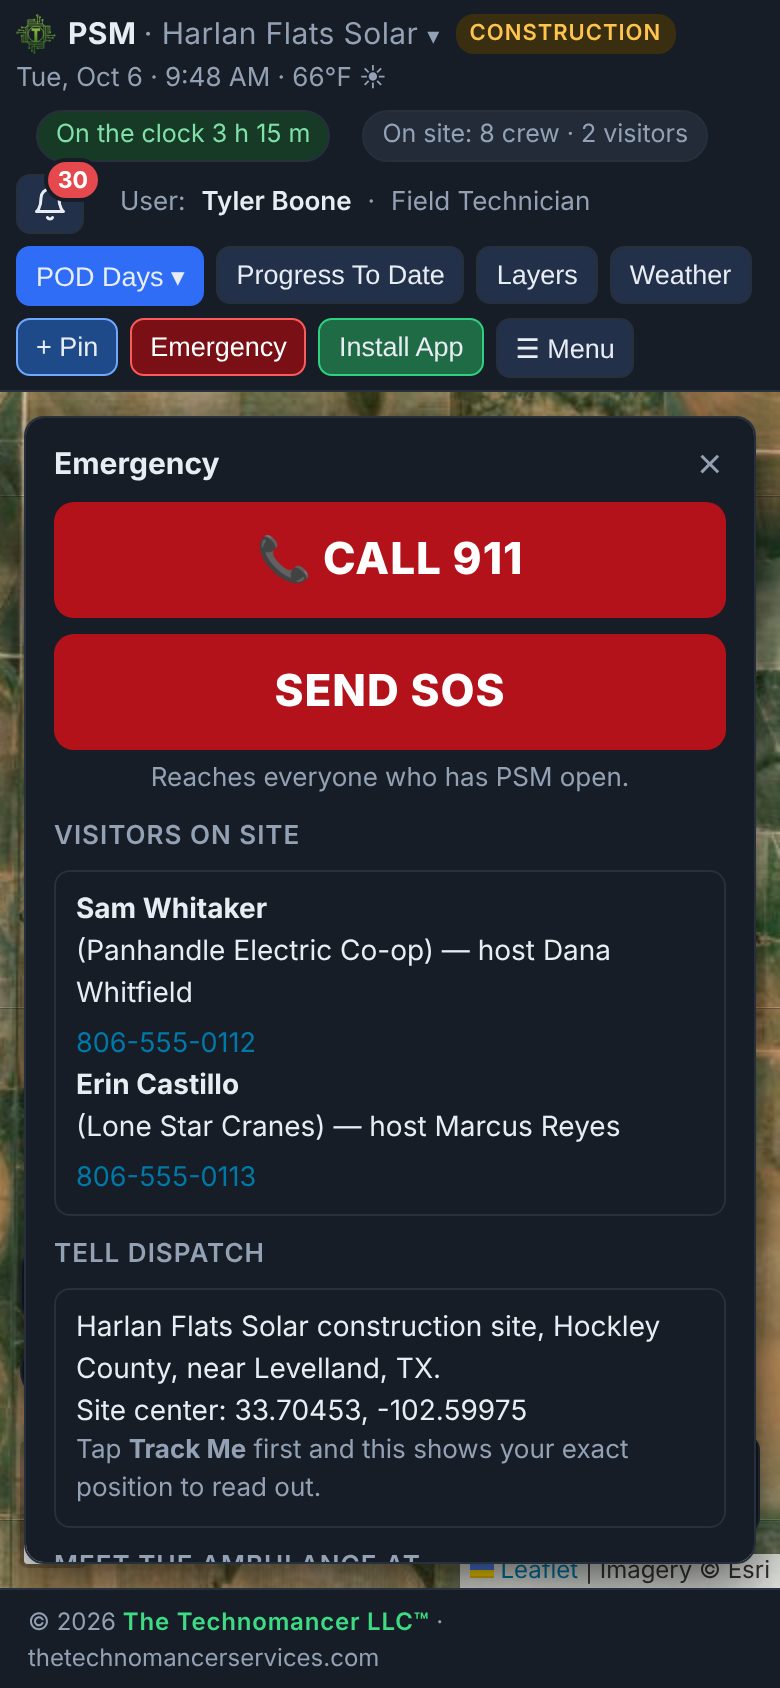
PSM Emergency panel with Call 911, Send SOS, visitors on site and dispatch details
Emergency and SOS

One red button with everything a responder needs

The Emergency button sits in the header of every map. When someone is hurt, nobody has to remember the site address, the gate code or which hospital has a trauma center.

  • Call 911 is the first button on the panel.
  • Send SOS. One tap alerts everyone who has PSM open, with the sender's name, GPS position and the nearest block or cabinet, so help comes from the closest crew. The SOS drops a red pin on everyone's map.
  • Active permits near the SOS. The alert lists every hot work, energized or confined space permit within 650 ft (200 m), so responders know what was happening at that spot.
  • Tell dispatch. The site name and your exact GPS coordinates, ready to read out to the 911 operator.
  • Meet the ambulance at the site entrance nearest you, with distance, map and turn-by-turn directions.
  • Nearest hospitals, found automatically at setup, with distance, phone and directions. Site safety and manager numbers sit below them, plus Poison Control.
  • Visitors on site with their company, host and phone, so the headcount includes people who aren't on the crew.
  • Safety points. Muster points, AEDs, first aid and eyewash stations pinned on the map, listed by distance from you.
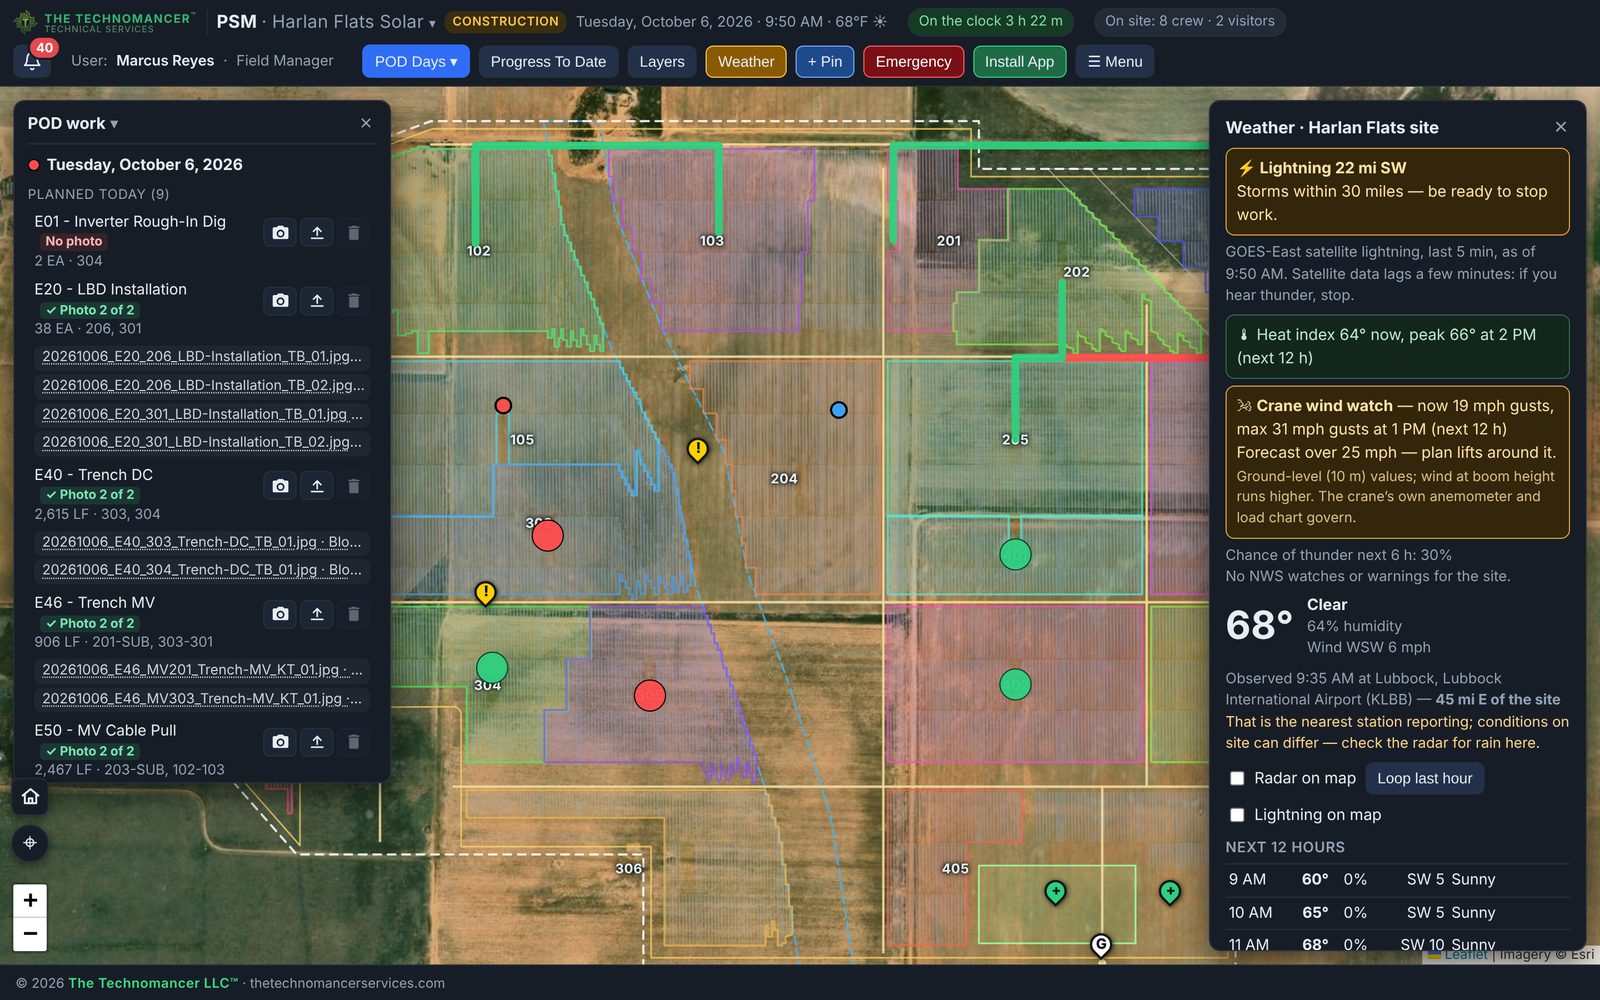
PSM Weather panel with lightning watch, crane wind watch and forecast
Lightning, heat and wind

Stop-work calls made from live data, for the whole crew at once

PSM watches the sky over your site and raises a banner on every phone when a threshold is crossed. Nobody has to step out and check a radar app.

  • Lightning from the GOES-East satellite lightning mapper, refreshed every 5 minutes, with 10-mile and 30-mile rings drawn around the site. A strike within 10 miles turns the banner red: stop work, take shelter. PSM then holds the warning for 30 minutes after the last flash and shows the time it is safe to go back out.
  • Honest when data is missing. If the lightning feed is late or down, the banner says so and tells the crew to stop work if they hear thunder. It never goes quiet.
  • Heat index from the nearest National Weather Service station and the forecast for the next 12 hours. The warning and extreme-heat levels are set per site (100°F and 110°F by default) and appear before the peak, not after.
  • Crane wind watch. Sustained wind and gusts against your crane limit (25 mph by default), with the forecast peak and its time, so lifts are planned around it.
  • National Weather Service watches and warnings for the site's location, sorted with the most serious first.
  • Radar and lightning layers on the map, with a one-hour loop.
  • Backs up your lightning policy. PSM supports your site's lightning procedure and detection; it doesn't replace them.
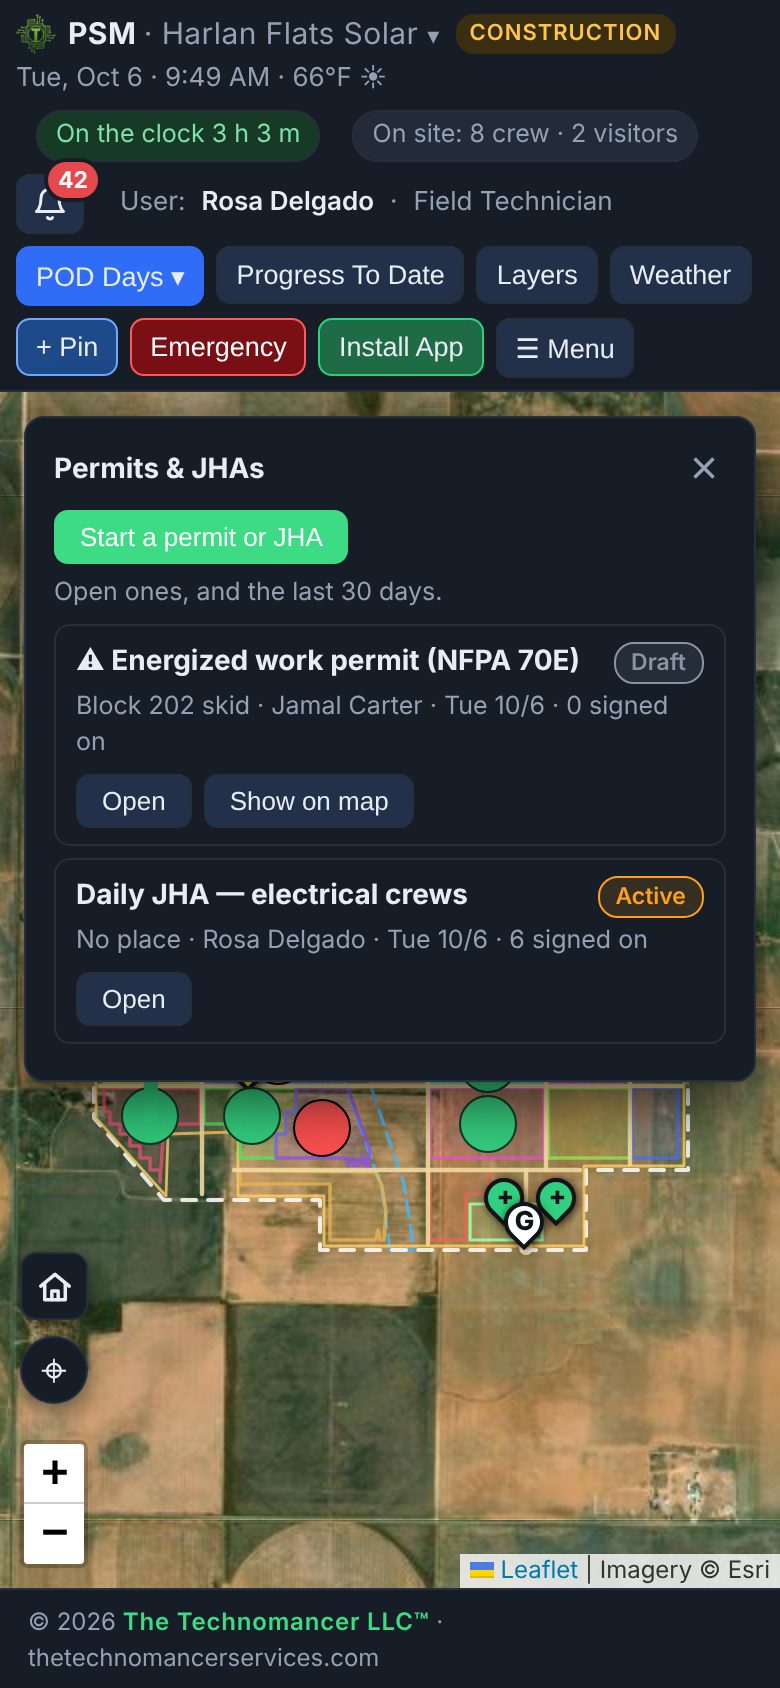
PSM Permits and JHAs panel with an energized work permit and an active daily JHA with six sign-ons
Permits and JHAs

Every permit, on the map, signed by the people doing the work

Job hazard analyses, toolbox talks and work permits live in PSM, tied to the place the work happens.

  • Your own templates for JHAs, toolbox talks, hot work, energized work, confined space and excavation, with the checks each one needs.
  • Approval where it matters. Hot work, energized, confined space and excavation permits wait for a Site Manager's approval before they go active. A JHA or toolbox talk is active as soon as it's made.
  • Sign on with a tap. Each worker's name, the server's time and their GPS position are stamped on the permit. No clipboard, no illegible signatures.
  • A record that holds up. A signed permit can't be deleted, and every permit has an end time (72 hours at most).
  • The time clock nudges anyone who clocks in without signing on to that day's JHA.
  • Pinned to the job. A permit can sit on a skid or block, so it shows on the map and in any SOS raised nearby.
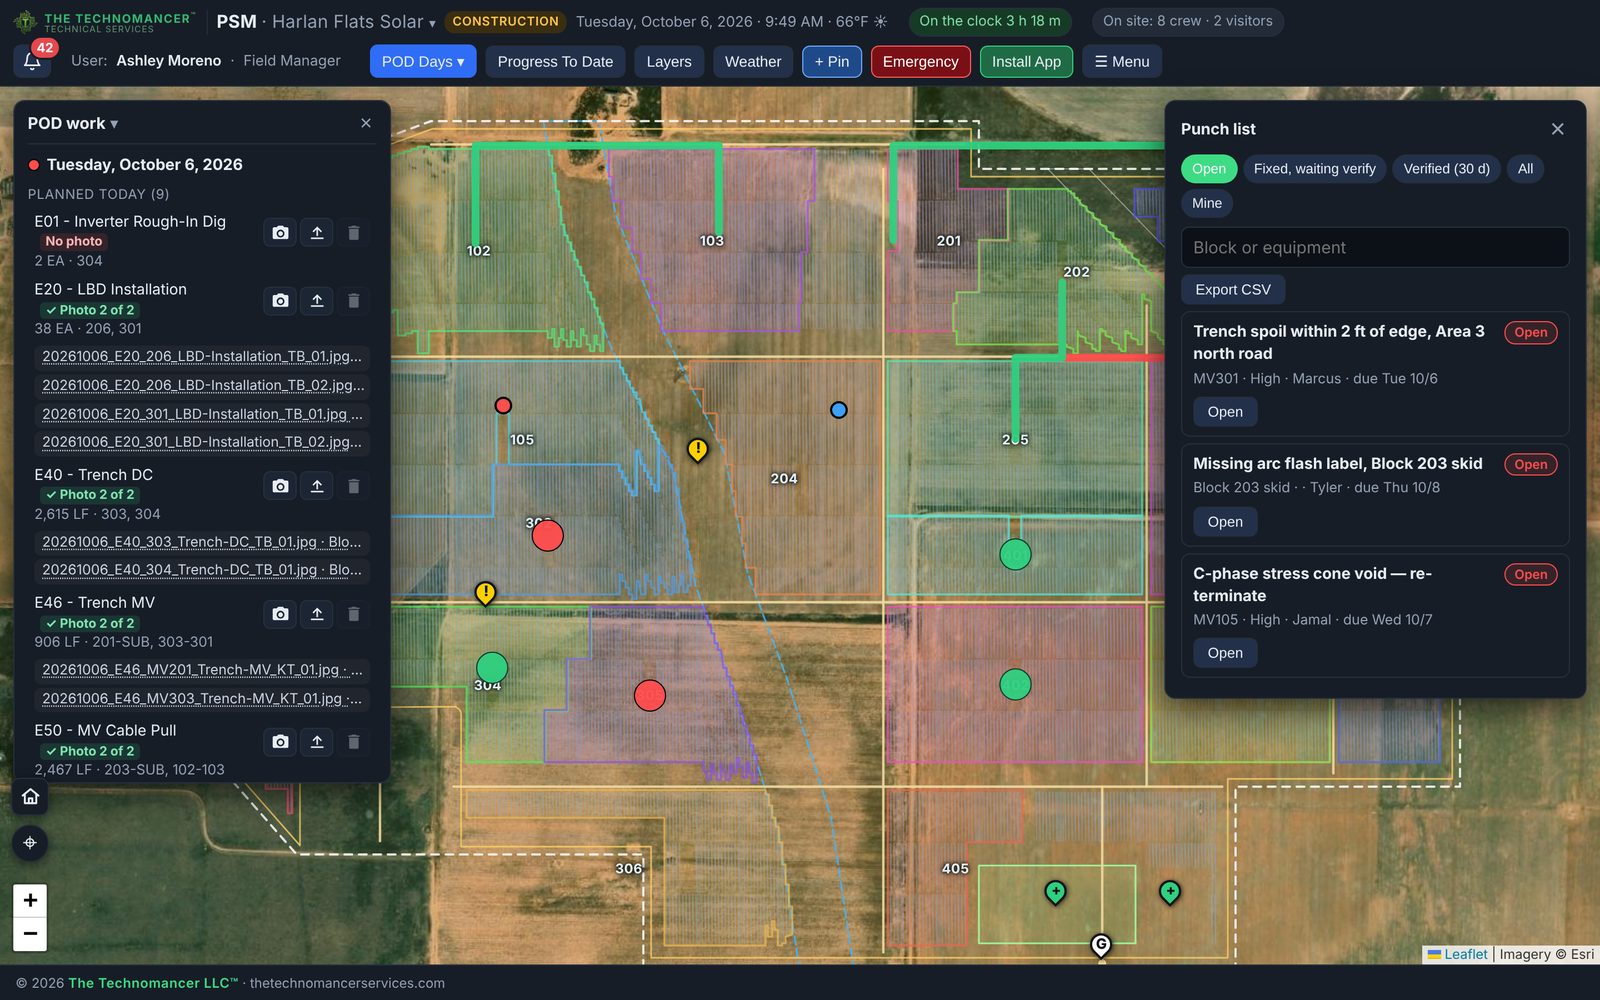
PSM map with hazard pins and the punch list panel
Hazards on the map

Open trench, hazards and punch items where the crew can see them

Anyone on the crew can drop a pin in seconds, and it shows on every map until it's closed.

  • Pin types for hazards, observations, punch items, utility locates, safety points and gates or delivery points, each with its own color and symbol.
  • Open trench shown from the POD: what's dug and not backfilled yet, so nobody walks or drives into it.
  • Punch list. A failed inspection item opens a punch item with a pin. It gets assigned with a due date, fixed with a photo, then verified. Filter by open, fixed or verified, and export to CSV.
  • Headcount at a glance. The header shows who is on site right now from the time clock, plus visitors checked in through the site's QR code.
Operations and maintenance

Run the plant from the map

At COD the construction map becomes the plant's operating map. Live SCADA, faults, maintenance and PPE all sit on the equipment they belong to.

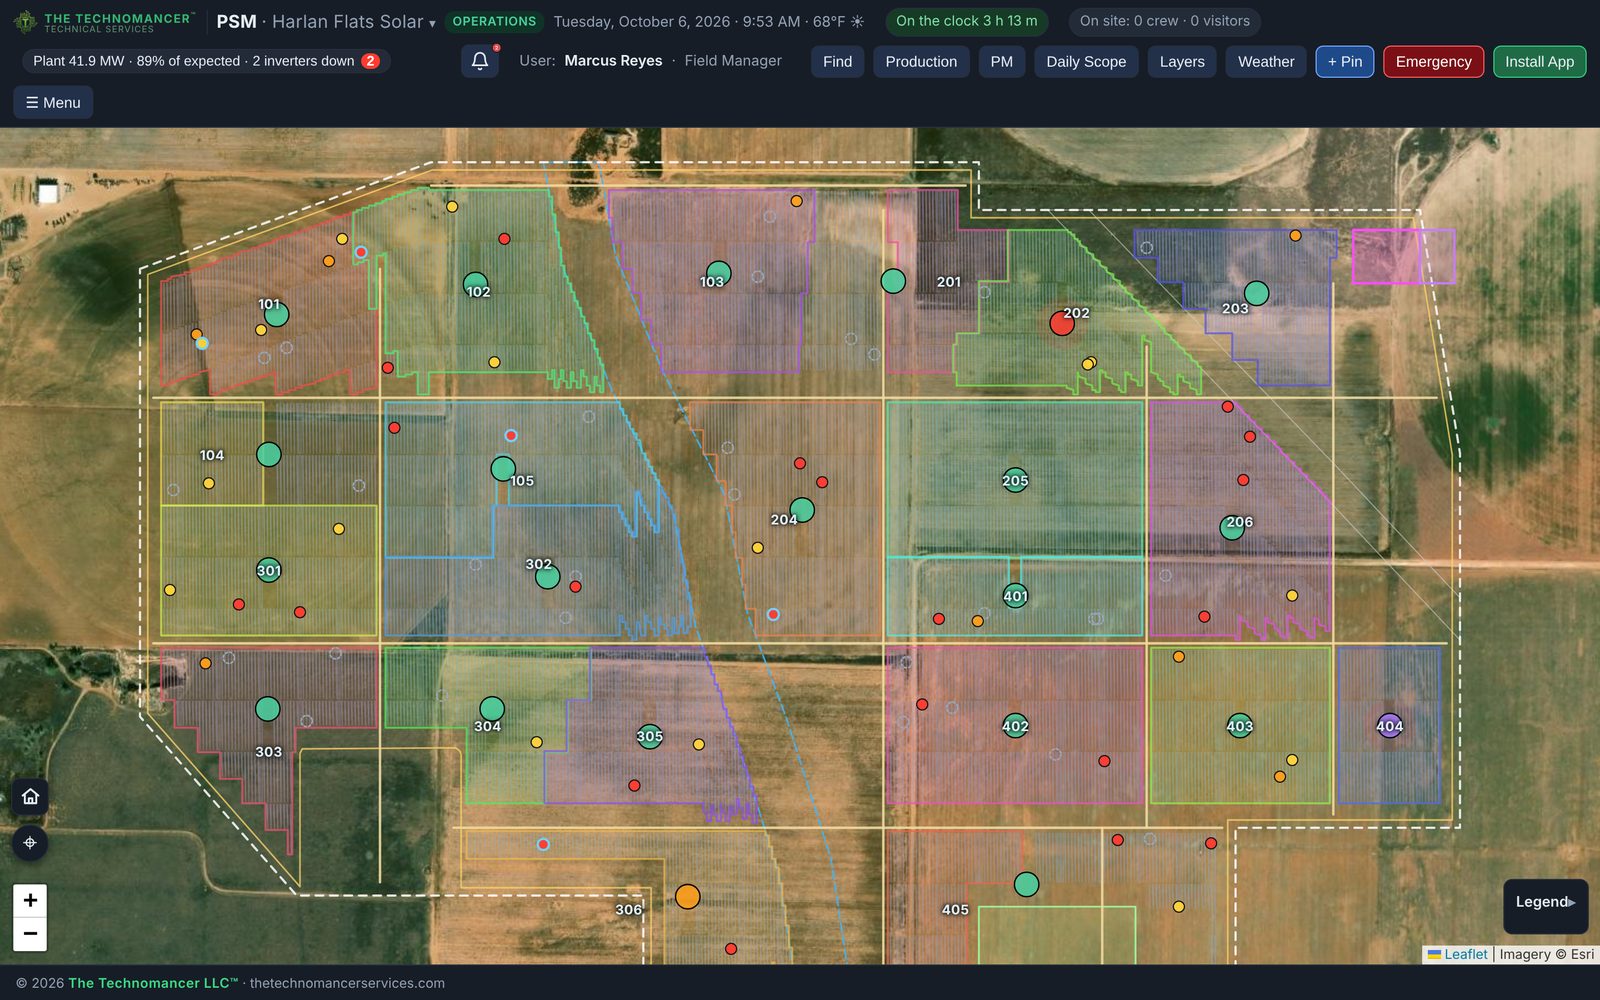
Operating plant map with each inverter skid colored by health, SolarEye findings and the plant status strip
Live SCADA and inverter health

See which inverter is down before anyone calls

PSM reads your plant SCADA through the PSM SCADA Bridge on site, or straight from your monitoring vendor's API, and keeps every open map current.

  • The status strip in the header shows plant output, percent of expected and how many inverters are down, on every phone.
  • Inverter health on the map. Each skid is colored live: running, low against expected, faulted, off or comms lost.
  • Expected output from your PVsyst model and the measured irradiance, so "low" means low for today's sun, not just a lower number.
  • Alerts for inverters down, low output, lost comms and missed targets go to Site Managers, leads and the assigned tech by bell and phone notification. Anyone can acknowledge and add a note.
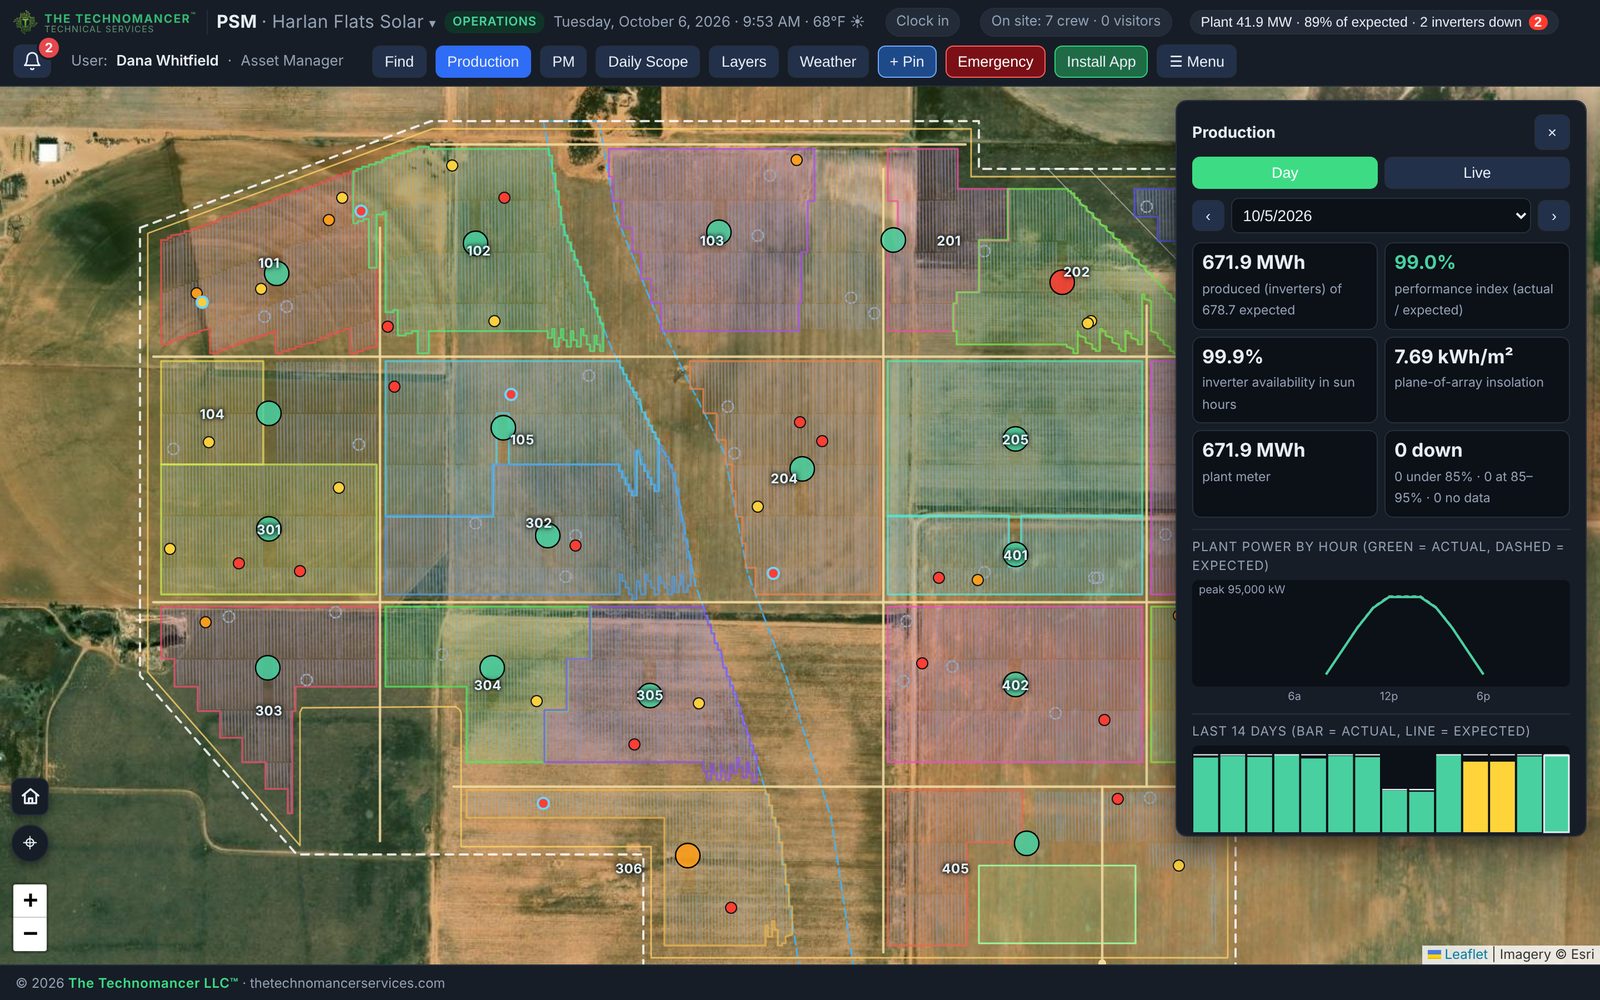
PSM Production day view with energy, performance index, availability, insolation, hourly power curve and the last 14 days
Production and targets

Energy, availability and performance index for every day

Upload a SCADA or DAS export, or let the bridge feed it, and PSM rolls it up per day and per inverter.

  • Per day: energy produced against expected, performance index, inverter availability during daylight hours, plane-of-array insolation and the plant meter.
  • Hourly power curve against expected, and the last 14 days at a glance. Low days stand out in color.
  • Targets for energy, availability and performance index for today, this week and this month, with gauges that turn amber and red.
  • Per inverter: energy, peak and availability, so the underperformer is named, not guessed.
  • Reads the exports most SCADA and DAS systems produce, from CSV or Excel.
Example
Fault report · Inverter PCS202E-31 · DC ground fault · since 9:05 AM
Probable causes
  1. Damaged DC homerun insulationmost likely · 3 of the last 5 E-31 faults on this site
  2. Water in a combiner boxlikely · rain logged 2 days ago
  3. Failed module or connector to groundpossible
  4. Insulation monitoring board faultunlikely · no other boards reporting
Verify, in this order
  1. LOTO the inverter DC disconnect and the combiners on circuit C2. PPE from the arc flash study: 8.2 cal/cm², arc-rated clothing and face shield, Class 4 gloves.
  2. Megger each combiner output to ground at 1000 V DC. Expect above 1 MΩ; record each value.
  3. Open the low combiner and inspect for water, then isolate and megger its strings.
  4. Clear the fault, restart, and confirm the insulation resistance reading on the inverter screen.
Fault reporting and troubleshooting

A troubleshooting guide built from your equipment's fault tables

When an inverter, tracker, combiner or transformer faults, PSM opens a fault report and a step-by-step guide built from the manufacturer's own fault code tables and service manuals.

  • Fault reports start themselves from a SCADA alert, with the equipment, fault code, time and live readings filled in. A tech can also open one from the map.
  • Probable causes, ranked. The guide lists what the manufacturer's data says can cause that fault code. It ranks them by the readings at the time, the weather, and what fixed the same fault before on this site and across your fleet.
  • Verification checks in order: what to measure, where, the expected value from the manufacturer, and the LOTO and PPE needed before each step. Results are recorded as the tech goes.
  • Closed with a root cause, the parts used, downtime and estimated lost energy, so the report is ready for warranty claims and availability reporting.
  • Ranked by your own history. Every closed report updates the cause ranking for that equipment model, your site and your fleet.
  • Fault history per piece of equipment on the map, so repeat offenders are easy to spot and plan around.
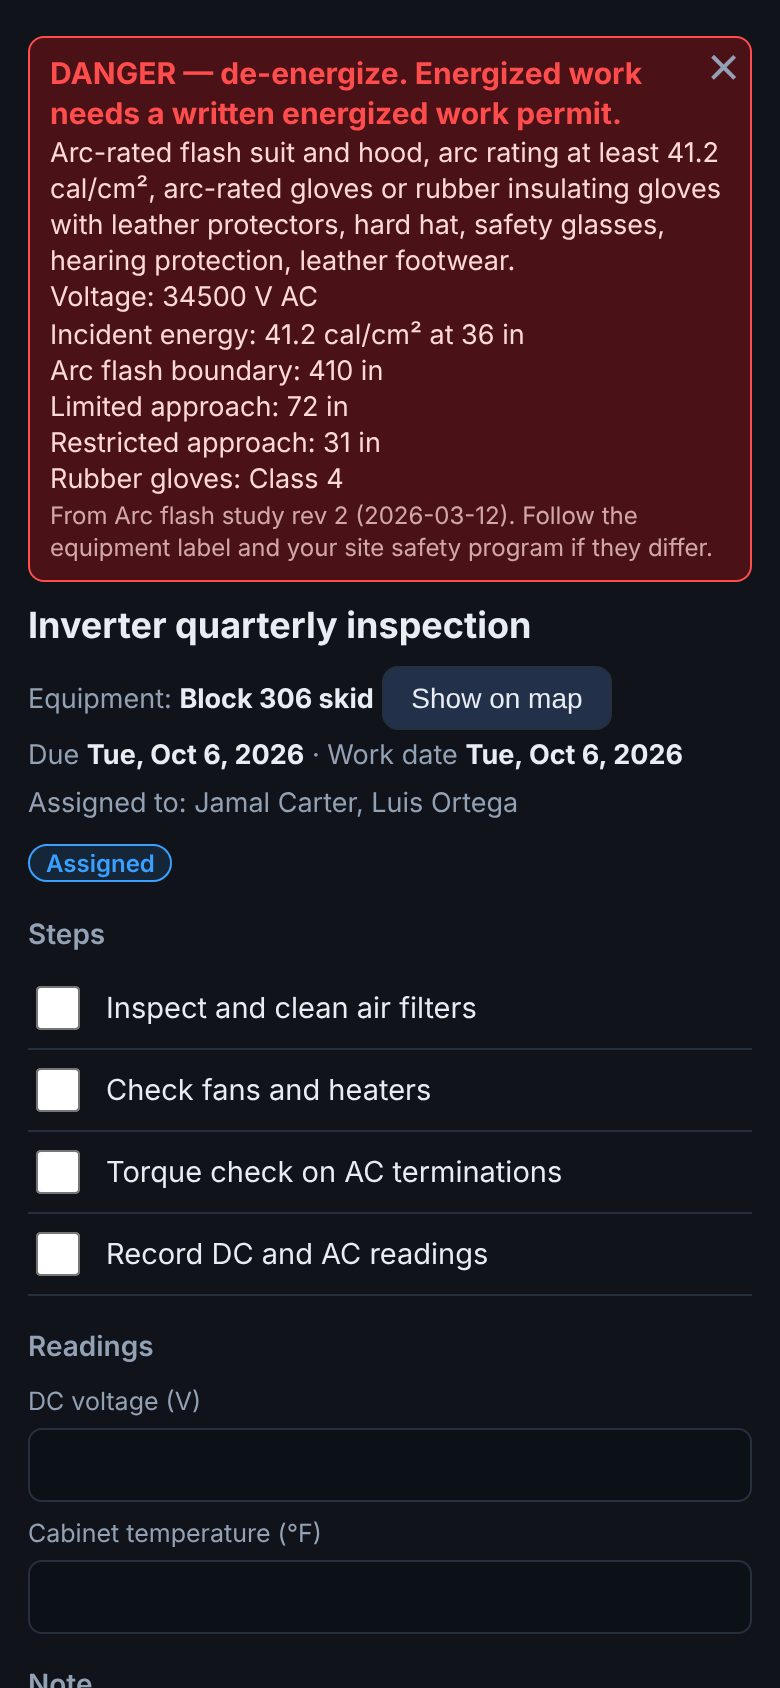
PM task on a phone with a red danger banner listing arc flash PPE, incident energy, boundaries and glove class for the transformer
PPE by equipment

The right PPE for the exact equipment, before the door opens

Upload your arc flash study once. Every task on that equipment then carries its PPE requirements.

  • From the study: voltage, incident energy at working distance, arc flash boundary, limited and restricted approach, and the rubber glove class for that voltage.
  • Plain-language PPE instructions for each incident-energy band, worded the way your safety program writes them.
  • Danger called out. Equipment above 40 cal/cm² shows a red banner: de-energize, and energized work needs a written permit.
  • LOTO and energized flags. When a block or circuit is flagged energized or locked out, every task on it shows that too, with who flagged it and when.
  • Never silent. Equipment with no study data says so and tells the tech to read the label and treat it as energized.
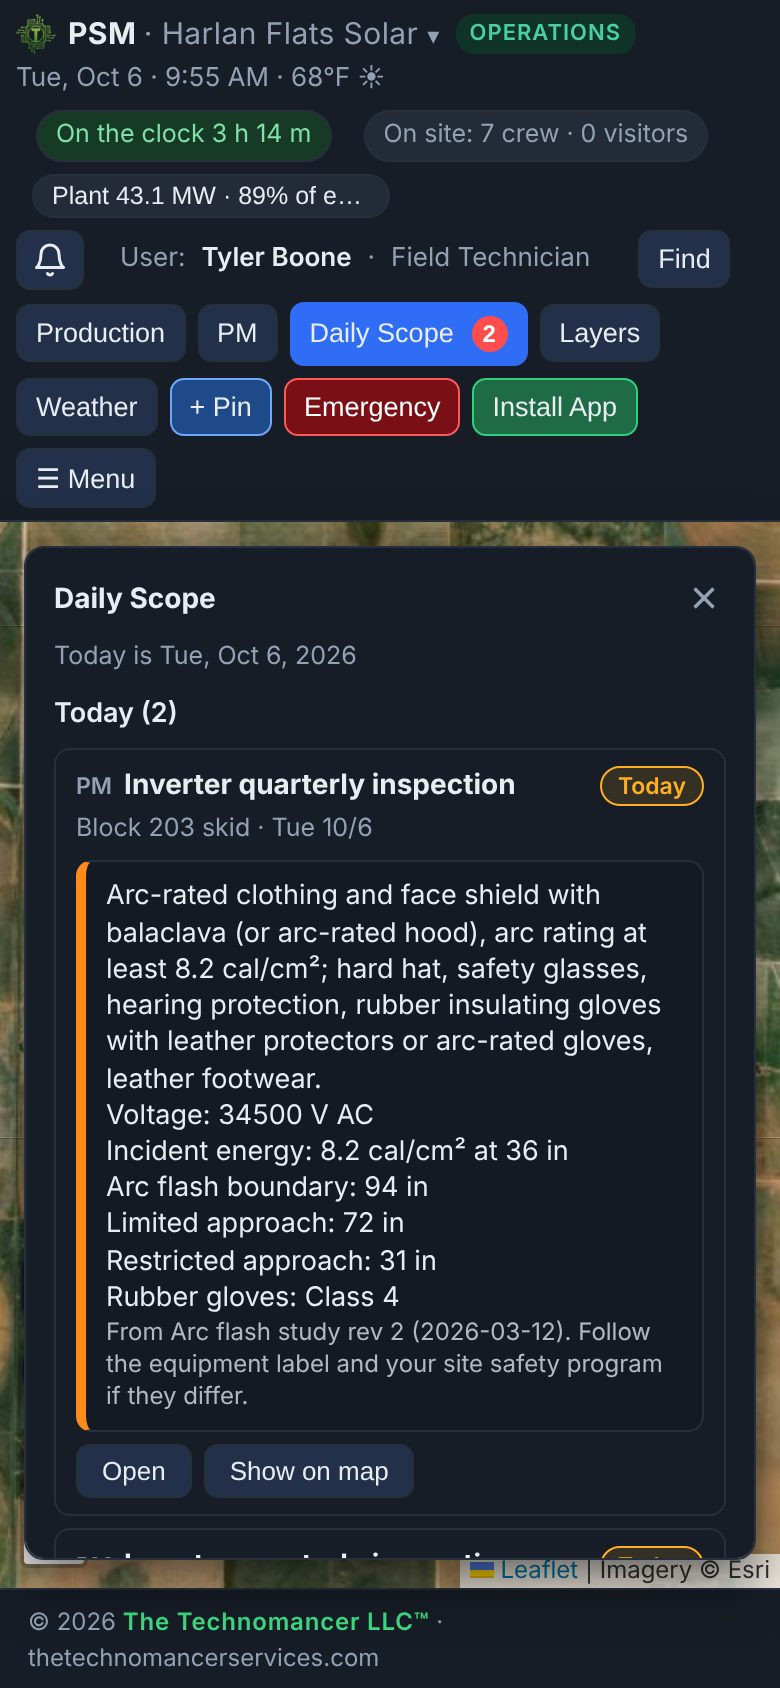
Daily Scope on a phone with today's PM tasks, each with its PPE requirements
Preventive maintenance and Daily Scope

Every tech knows what to do today, and how

Preventive maintenance plans are uploaded from Excel. PSM schedules them and puts each tech's day in one list.

  • PM plans with frequency, steps, readings to record and estimated hours, tied to the equipment on the map.
  • Daily Scope lists each tech's PMs, punch items, inspections and one-off tasks for the day, with the PPE for each.
  • Done on the phone: tick the steps, record the readings, add photos and notes, and send it for sign-off.
  • Due and late work is flagged, and managers assign or move tasks with a pop-out calendar.
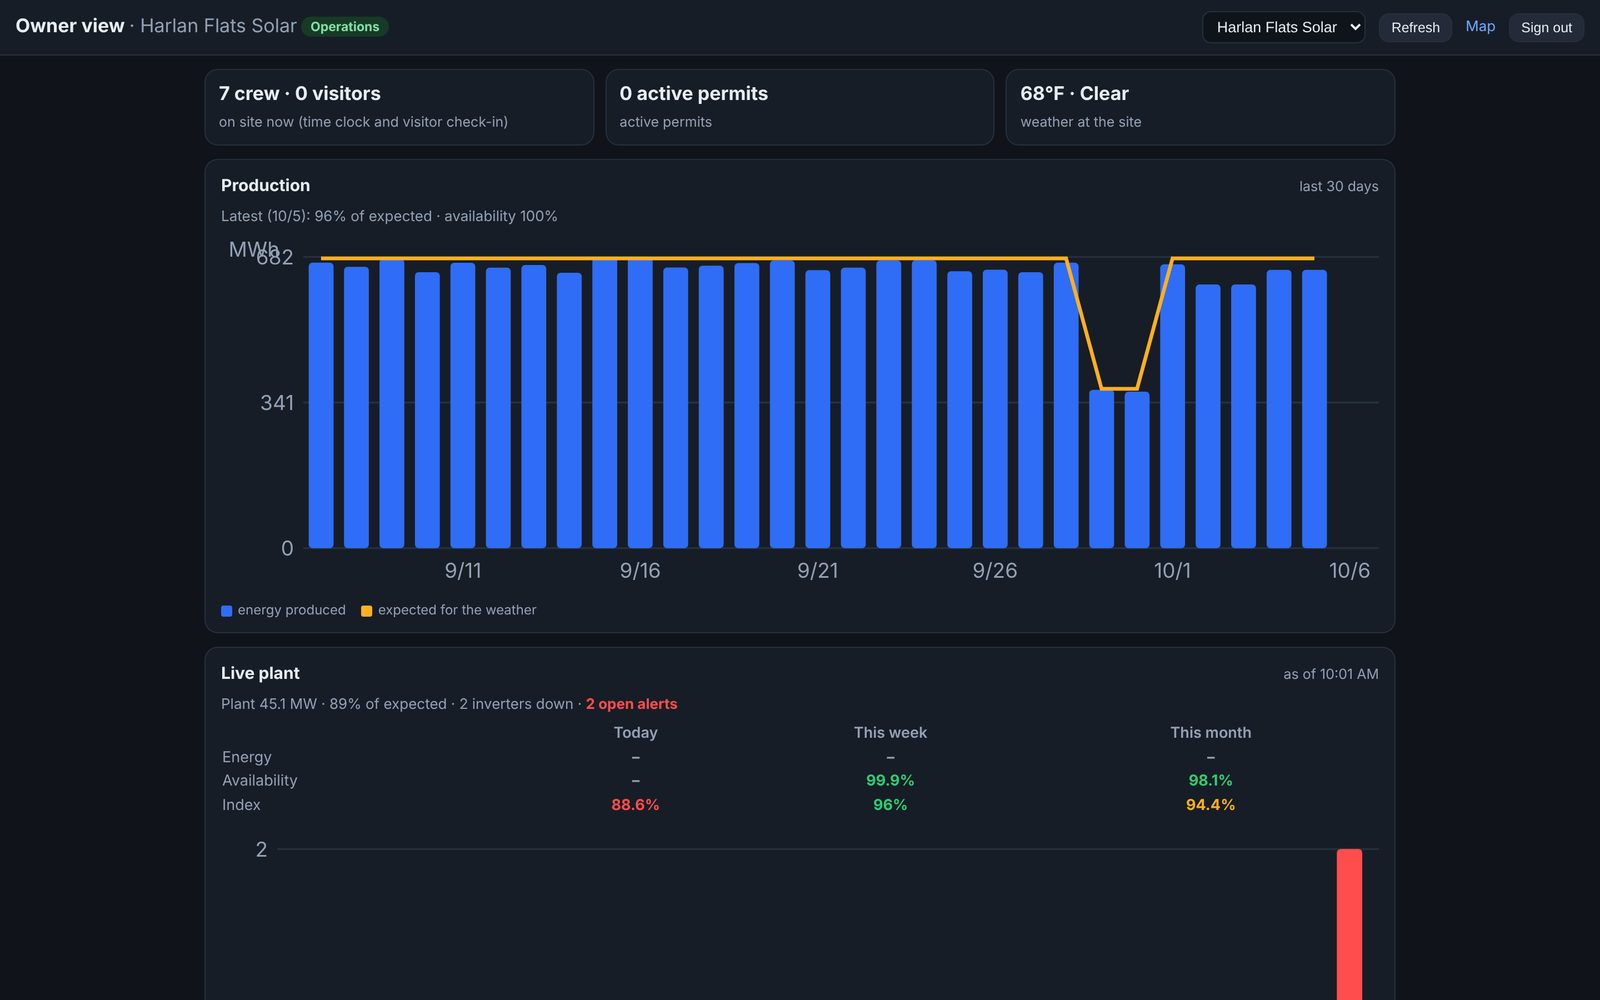
PSM owner view for an operating plant with 30 days of energy against expected and live plant status

Owner view

A read-only page for the asset owner: production, crew and visitors on site, active permits, weather, progress, plan vs. done, photos per day and every daily report.

Tools and calibration

Test equipment with its calibration date and who has it. It turns amber 30 days before calibration is due, red when overdue, and warns on any reading taken with an overdue tool.

Visitor check-in

A QR code at the gate opens a check-in page that needs no account. Visitors pick a host and are counted on site and in the Emergency panel.

Construction, from first pile to COD

For the EPC, the owner's team and the inspectors: the plan, the work, the photos, the QA and the hours in one place.

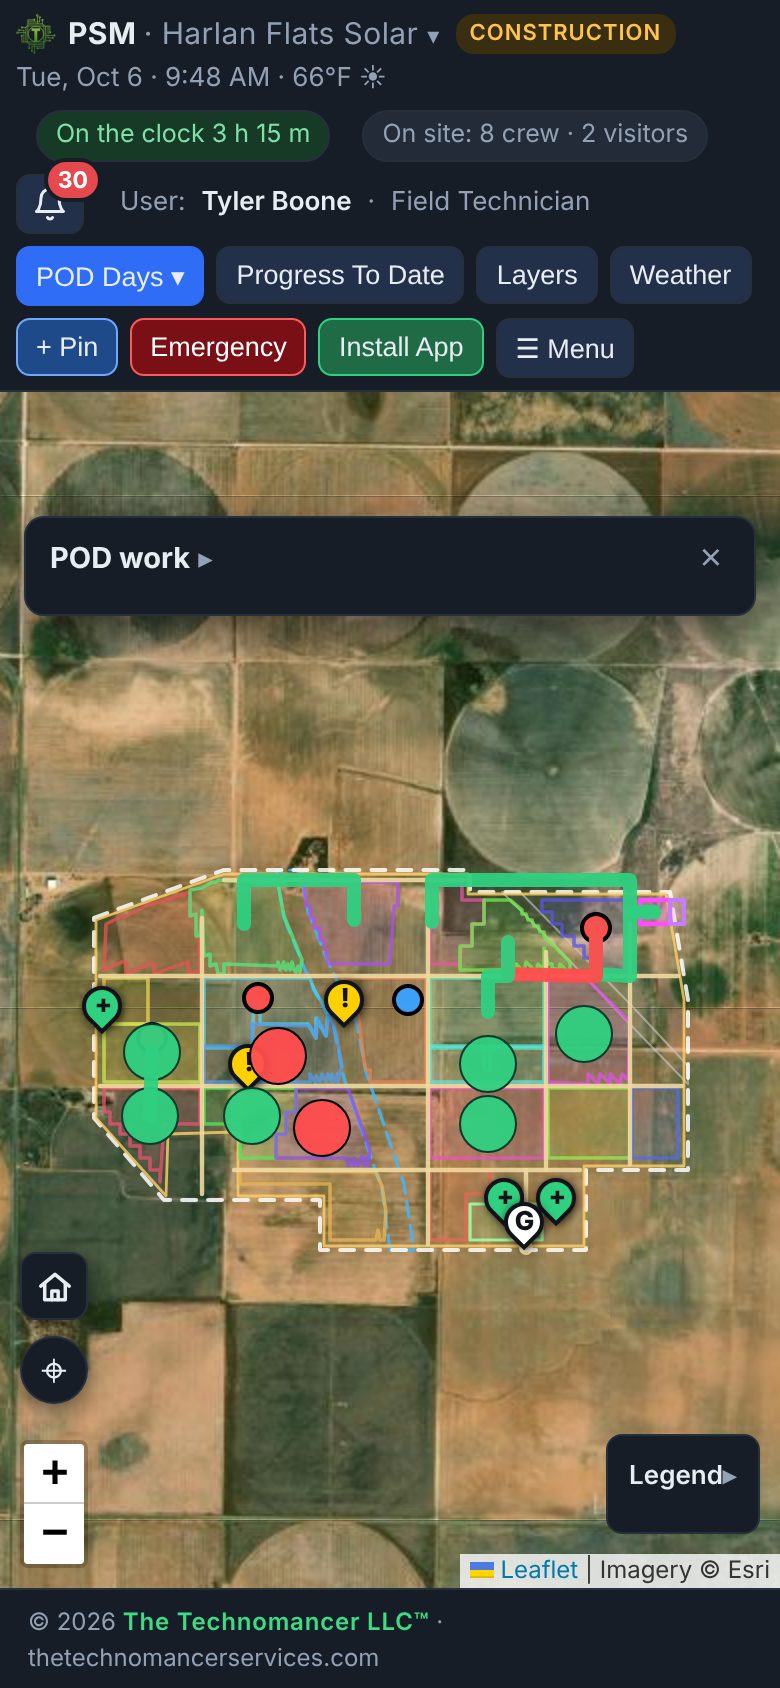
PSM site map on a phone with POD work and photo status
Site map and POD

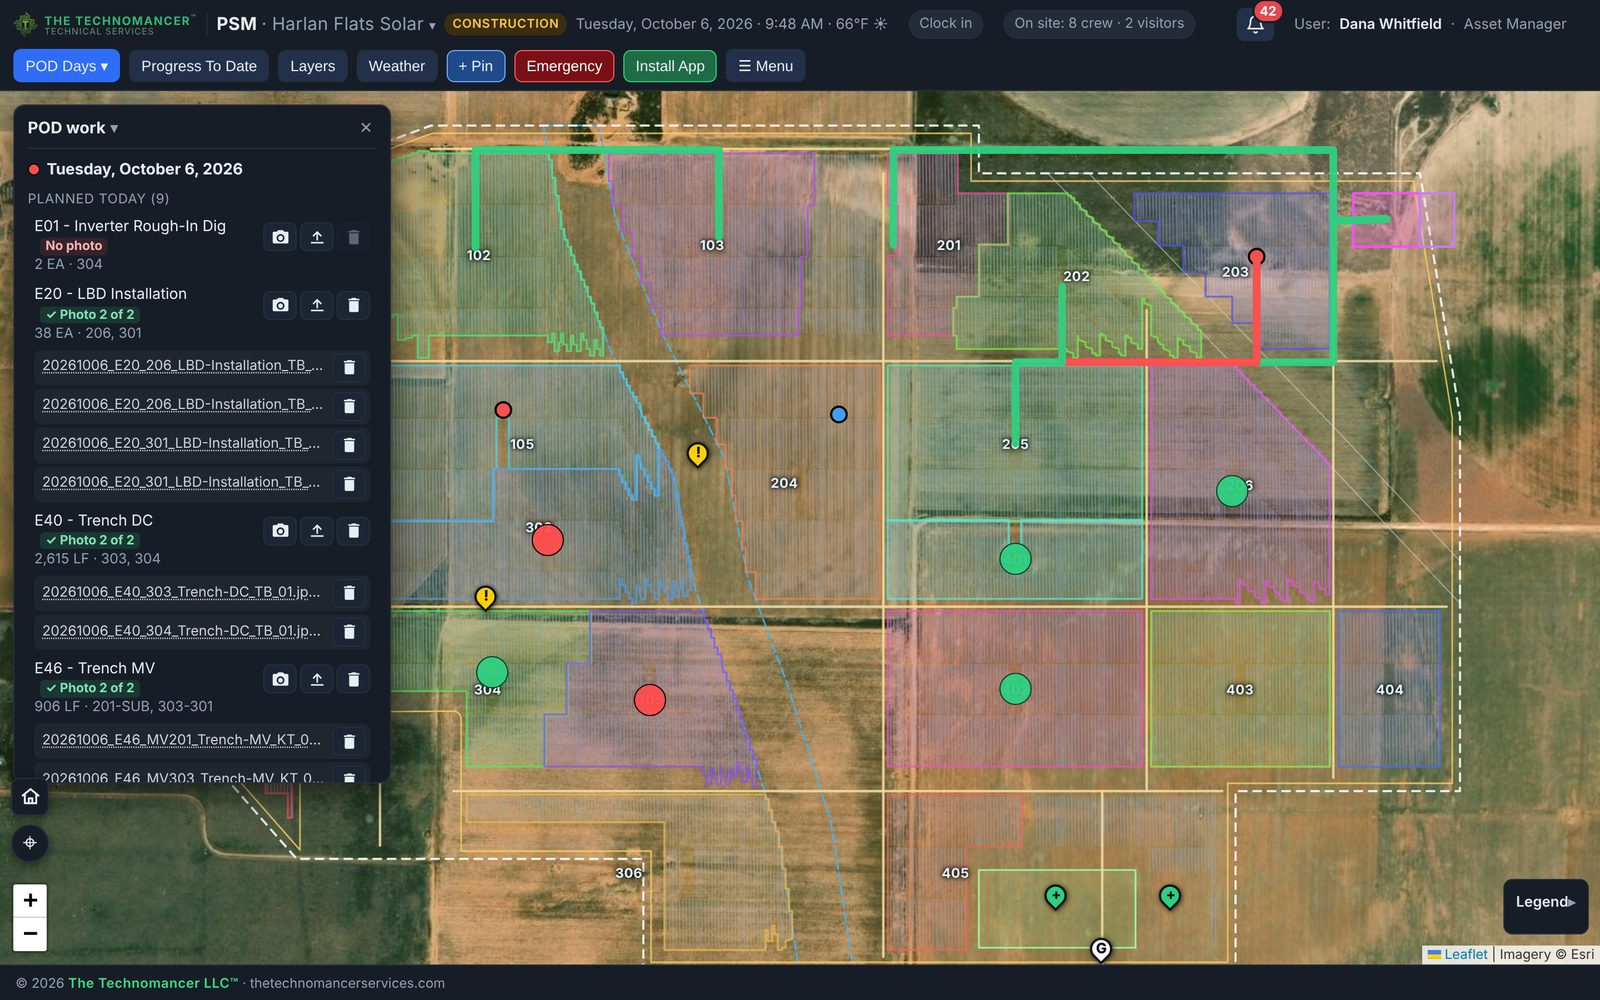
Today's plan of the day, drawn on the site

The map is the satellite image with your layout on top: blocks, tracker rows, inverter skids, sectionalizing cabinets, MV routes, roads, fence and substation.

  • The POD on the map. Each planned activity is drawn at its block, skid or cable run. MV runs follow the actual trench route, not a straight line.
  • POD days. Flip back through every day's plan to see what was worked where.
  • Plan vs. done. When the next POD arrives, PSM checks yesterday's plan against what was reported and lists what was short, not done or dropped, and for how many days in a row.
  • Progress to date for every activity, from the contractor's own totals, plus open trench and how many days each place has been worked.
  • Layers for DC cable, load break disconnect (LBD) racks, bores, utilities, wetlands and flood zones. Tap anything for its details and its drawing sheets.
POD work list with photo badges and file names
Required photos

Photo evidence that's named, placed and counted

Every task on the POD has a camera button. Photos go through the Photo Processor, which names them to your convention and ties them to the place and the work day.

  • Automatic file names with the date, activity code, location, task and the person's initials, so turnover photo logs come out sorted by place and activity.
  • Photo status on every task. "No photo" or "Photo 2 of 2", and green on the map once a place is covered.
  • Taken offline, sent later. Photos taken without signal wait on the phone as "Not saved yet" until they can go.
  • Turnover in view. What's photographed and what's still outstanding, by place, before anyone asks.
PSM inspection form for an MV termination with pass, fail and torque value
QA inspections

Checklists done on the equipment they belong to

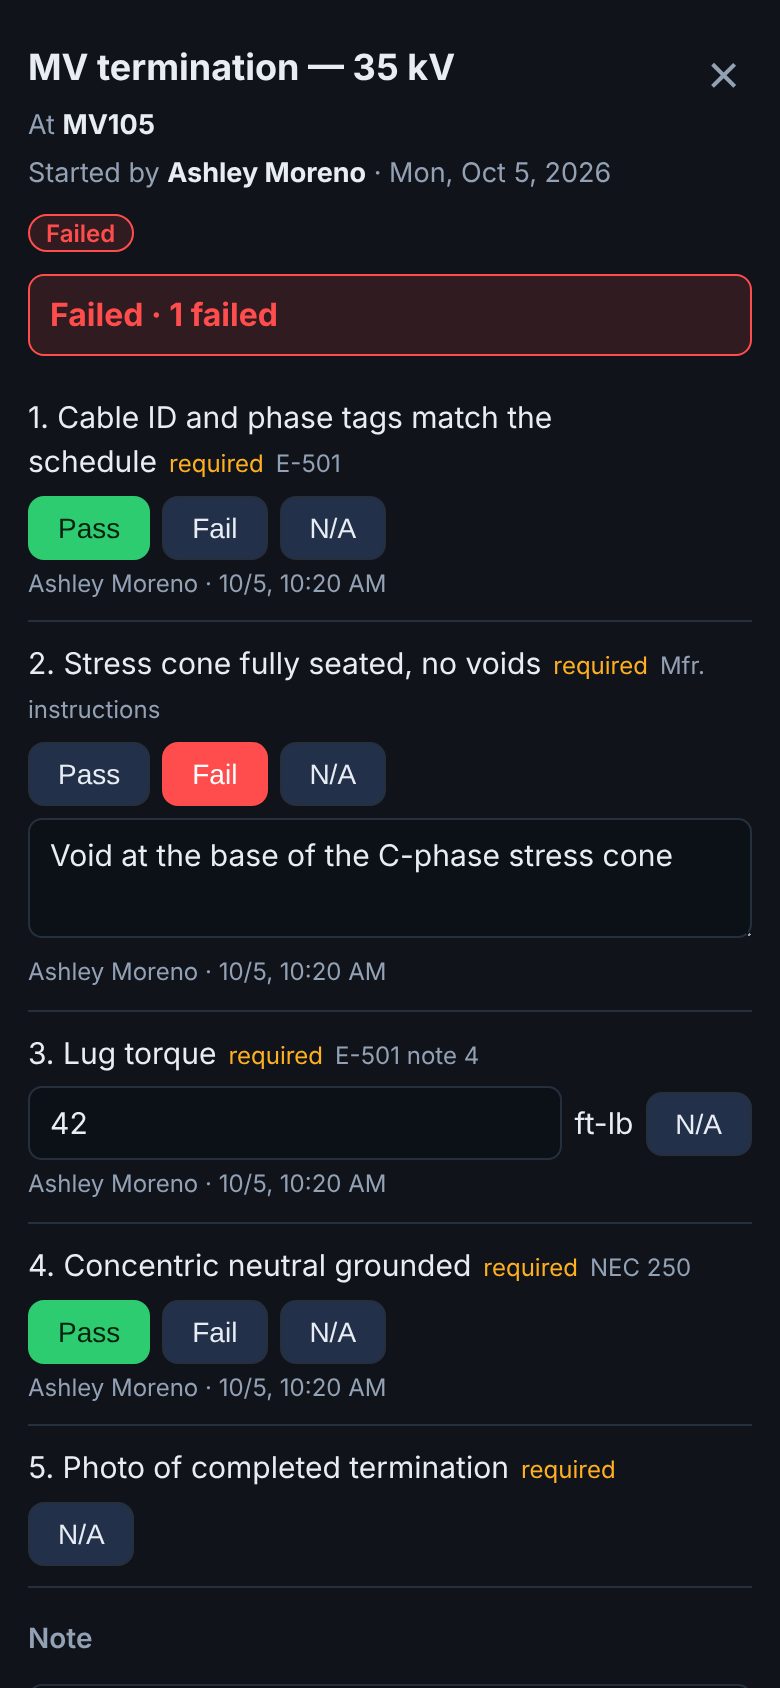
Your QA/QC forms are uploaded from Excel and filled in on the phone, at the skid, run or block being inspected.

  • Item types: pass/fail, a measured value with its unit (torque, megger), yes/no, text and required photos. Each item can carry its spec or drawing reference.
  • Every answer is stamped with who answered it and when.
  • A fail becomes a punch item on the map, ready to assign.
  • Edit forms in the app, retire old ones.
PSM daily report with weather, crew on site, visitors, inspections, punch list and permits
Daily report

The end-of-day report, already written

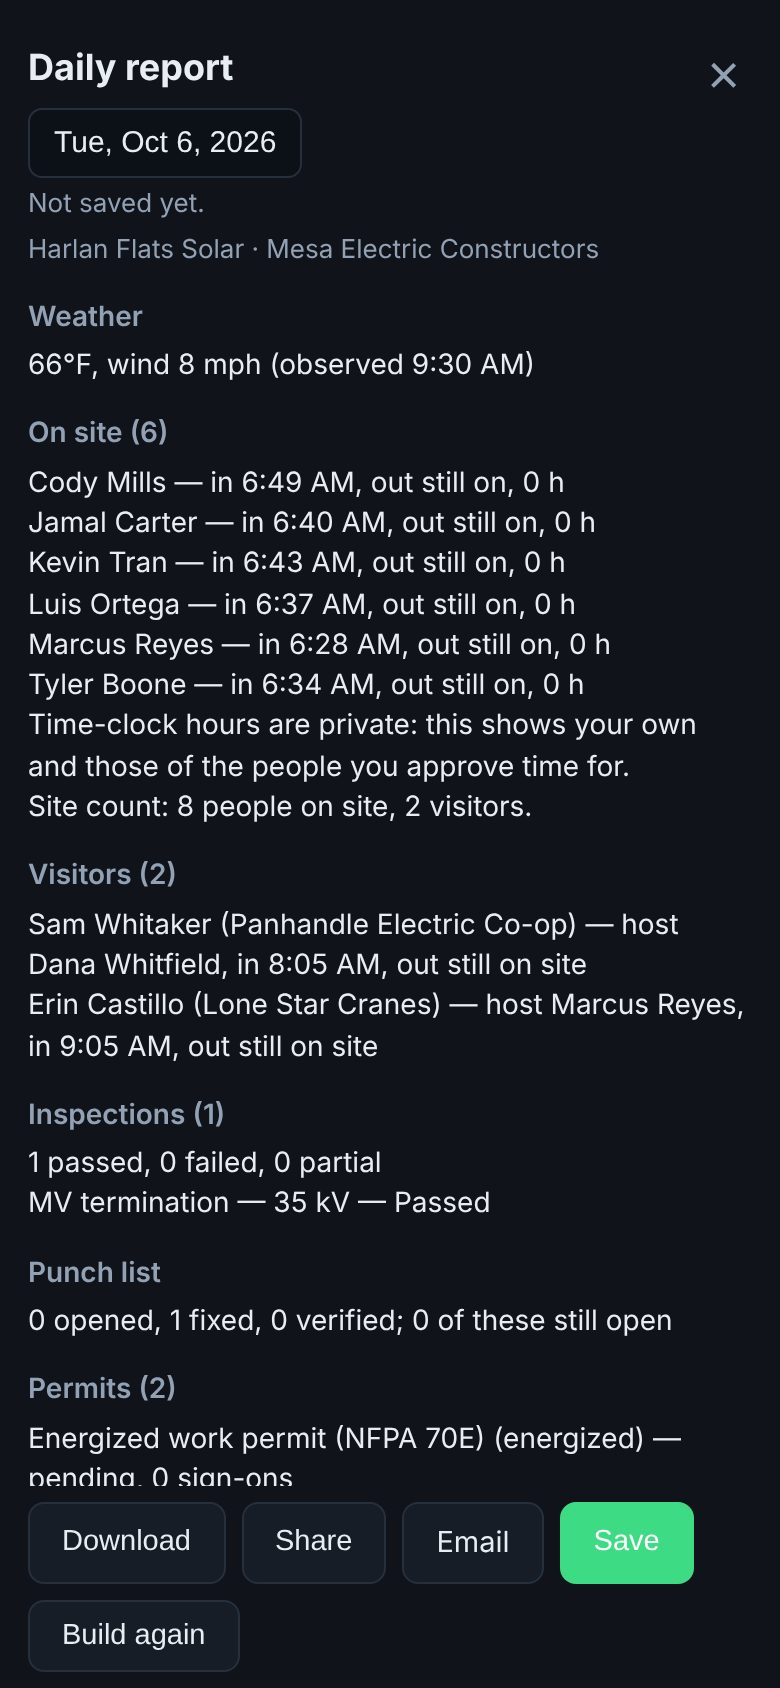
PSM builds the daily report from the day's records. The supervisor adds notes and sends it.

  • What's in it: weather, crew on site and hours, visitors, POD plan vs. done, photos registered, inspections and results, punch items opened, fixed and verified, active permits, SOS events and notes.
  • A PDF with your company name, ready to download or share.
  • Email it to a saved list in one tap.
  • Kept in the app, so the owner view shows every day's report.
PSM time clock with clock out button and today's shift
Time clock

Hours, PTO and approvals without a paper timesheet

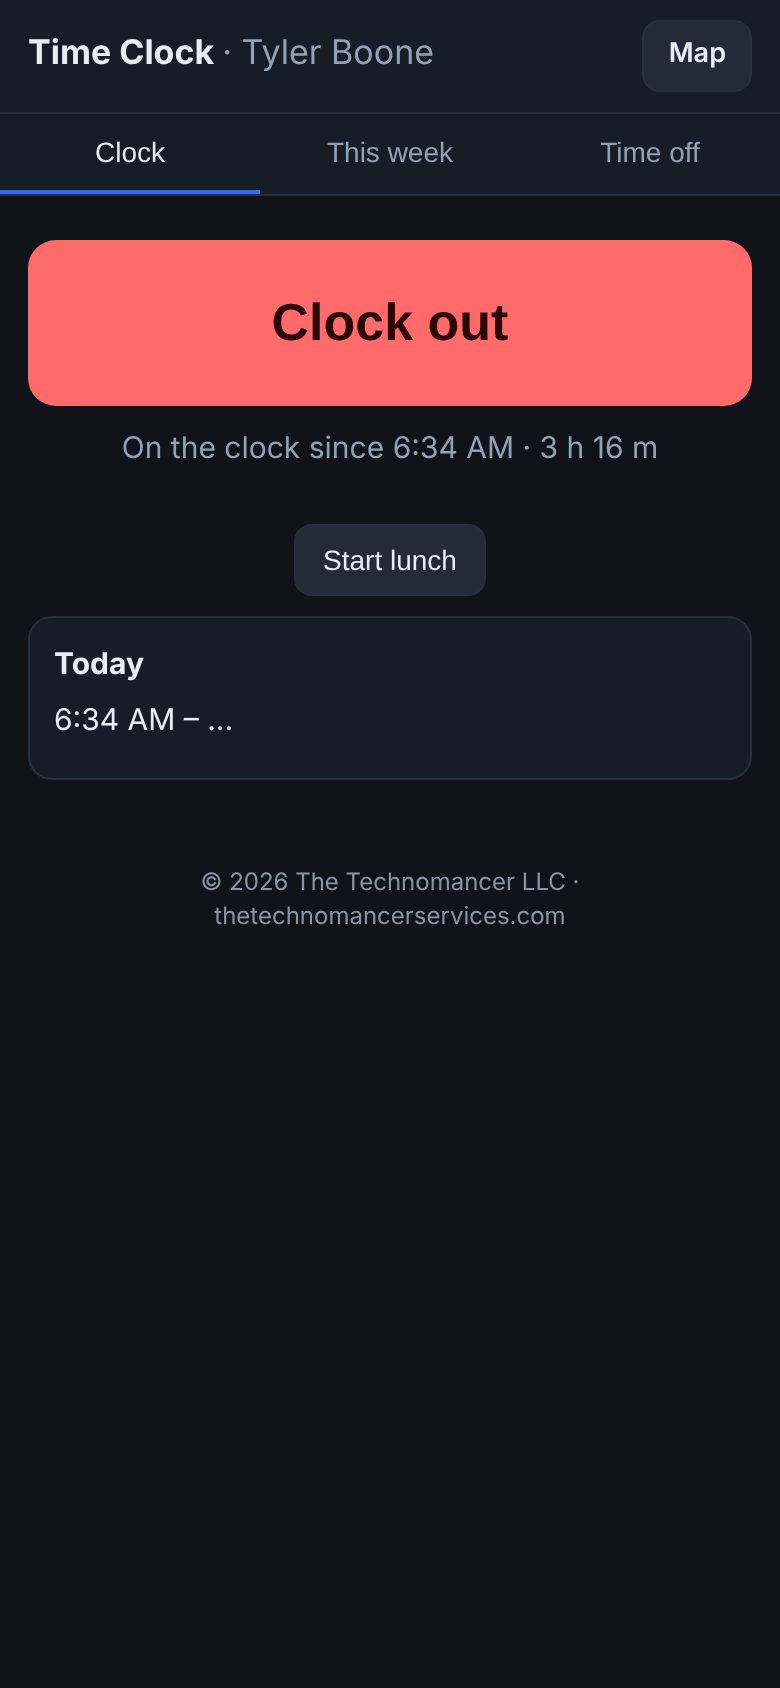
Crews clock in and out on the same app. Managers see who's on the clock, approve the week and export payroll.

  • GPS punches. A punch outside the project boundary is flagged for the approver.
  • Your rules for lunch, breaks and overtime, set per site.
  • PTO and sick requests with approval by each person's own approver.
  • Flags for a missing clock-out, a double clock-in or a punch sent late after signal returned.
  • Live view of who's on the clock and where, and a payroll CSV export.
SolarEye

Drone thermal inspections, on the same map your crew uses

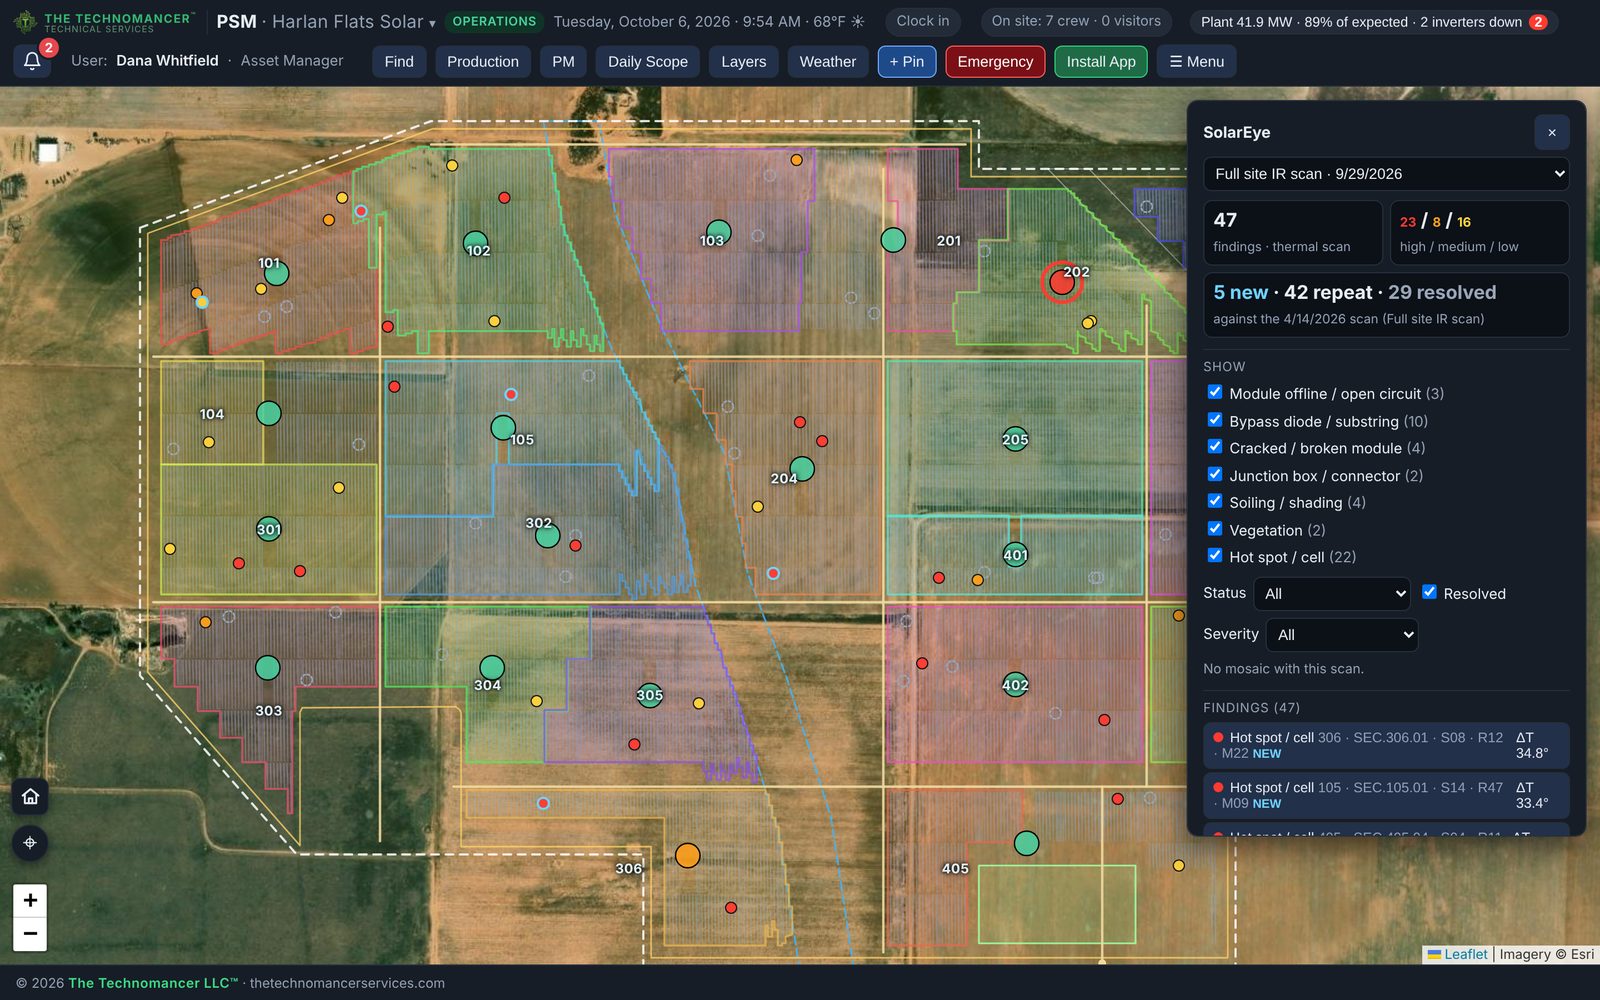
SolarEye turns a thermal drone flight into a list of module faults, each one placed on the site map down to the block, combiner, string, row and module, with how hot it runs and what to do about it. The crew walks straight to it, fixes it, and the next flight proves it's fixed.

PSM SolarEye panel with 50 findings from a September thermal scan, compared against an April scan, colored by severity on the site map

From flight to fixed, in six steps

  1. 1Fly

    Your pilot flies the array with a radiometric thermal drone such as the DJI Matrice 30T or Matrice 4T, our flight crew flies it for you, or a drone dock on site flies it on a schedule with no one there.

  2. 2Process

    SolarEye reads the true temperature of every pixel, stitches the flight into thermal and visual orthomosaics, and finds and classifies each anomaly.

  3. 3Locate

    Each finding is matched to your as-built drawings and named by block, combiner, string, row and module.

  4. 4Publish and compare

    Within about a minute of processing, the scan is on the site map, sorted into new, repeat and resolved against the last flight.

  5. 5Fix

    One tap turns a finding into a punch item or observation, assigned to a tech with a due date. It's fixed with a photo and verified.

  6. 6Report

    The owner gets a plant health and status report and a read-only view of every scan and finding.

What it does for the plant

Production back faster

An offline string or a failed bypass diode loses energy every sunny hour until someone finds it. SolarEye points straight at it, so repairs start the same day instead of waiting for a monitoring trend to get noticed.

Fire and safety risk caught early

Overheating junction boxes, connectors and cracked glass are flagged high severity with their peak temperature, so they're dealt with before they become a fire or an exposed-conductor hazard.

Evidence for warranty claims

Every finding carries its location, ΔT, peak temperature, scan date and history across scans. That's the documented record a module or inverter warranty claim needs.

Cleaner commissioning and turnover

Flown before COD, a scan turns hidden install defects into punch items while the contractor is still on site. The owner takes over a plant with a clean thermal baseline.

Proof that repairs worked

The next flight marks each fixed finding resolved and flags anything still hot as a repeat, so you know what was really repaired, not just what was closed.

Work planned by severity

Severity follows the IEC TS 62446-3 thermography classes. Crews fix what's costing energy or creating risk first, and soiling and vegetation get batched into routine O&M.

Flown on your schedule

Fly after a storm, before a warranty deadline, or every month. Your pilots, our crew or a dock on site, whichever suits the plant, so you aren't working around a service provider's calendar.

One record for the life of the plant

Scans sit on the same map as the as-builts, the punch list, the PMs and the photos, from the commissioning scan to every annual inspection after it.

From flight to findings

Radiometric analysis built on industry standards

  • Works with the drones crews already fly, such as the DJI Matrice 30T and Matrice 4T, reading the true temperature in every pixel of the radiometric images, not just the colors.
  • Stitches the flight into a georeferenced orthomosaic of the array, in thermal and visual.
  • Finds and classifies anomalies: hot spots and cells, bypass diode and substring faults, modules and strings offline, cracked glass, junction box and connector heating, PID patterns, soiling, shading, vegetation and tracker problems.
  • Severity from the temperature rise (ΔT), following IEC TS 62446-3 guidance: 20 K or more is high, 10 K to 20 K is medium, below 10 K is low. Each finding carries its ΔT, peak temperature and a recommended action.
  • Placed by your as-built drawings. SolarEye reads the CAD as-builts and names each finding's block, combiner, string, row and module.
On the map

Every scan compared with the last one, automatically

  • Hands-free publishing. When a scan finishes processing, SolarEye publishes it to the right site's map within about a minute. Every open map shows it.
  • New, repeat, resolved. Each finding is matched against the last scan of the same ground, within 6 ft (2 m). You see what's new, what's still not fixed, and what was repaired.
  • Filter by fault type, severity and status, with the thermal or visual mosaic under the findings and its opacity adjustable.
  • One tap to a work order. A finding becomes a punch item on a construction site or an observation on an operating plant, assigned and tracked to verified like any other.
  • On construction and operating sites, from commissioning scans to annual O&M inspections.
  • Owner health report. A plant health and status report for the asset owner, plus a read-only owner view of the scans and findings.

Three ways to fly

Your pilot

Your Part 107 pilot flies a radiometric thermal drone such as the DJI Matrice 30T or Matrice 4T and uploads the flight. SolarEye does the rest.

Our flight crew

A PSM pilot comes to site with a radiometric thermal drone, flies the array to IEC TS 62446-3 image requirements, and the scan is on your map when processing finishes. Nothing to buy, no one to train.

A drone dock on site

A DJI Dock 3 with a Matrice 4TD lives on site, charges itself and flies on a schedule or on demand, including right after a storm passes. Bring your own dock, or let us install and run one for a monthly fee.

Same results every way

However it's flown, every scan is processed the same way, placed on the same map and compared with the last one, so you can mix options across sites and seasons.

In every finding

Fault type, severity, ΔT and peak temperature; block, combiner, string, row and module; the recommended action; IR and visual close-ups; its status against the last scan (new, repeat or resolved); and a link to the punch item or observation it became. Findings export to GeoJSON, CSV and KML, and mosaics to GeoTIFF, so they work in GIS and other tools too.

Project records, tied to the site

The document control and project management side of the job: files, drawing sets, RFIs, submittals, change orders and meeting minutes. Every record can point at a block, skid or cable run, so it opens from the map where the question started.

Documents

A document library with real version control

  • Folders up to 8 deep, starting from a ready tree: Drawings, Specifications, Submittals, RFIs, Change orders, Meetings, Safety, Manuals and O&M, Photos and Contracts. Each folder can be open to everyone, to the crew only, or to managers only.
  • Drag and drop many files at once, with a progress bar and pause and resume. Uploading the same name again offers a new version or keeping both, and a duplicate file is spotted by its fingerprint.
  • Full version history. Open any old version, or make it current again without losing anything.
  • Check out a file so two people don't revise it at once. Others can still view it, and the lock releases itself after 24 hours.
  • Status and tags: draft, issued, superseded or void, tagged to blocks, equipment and cable runs. Search covers name, number, tags, folder, status, uploader and date across the whole library.
  • Keep offline on a file or a whole set, so it opens in the field with no signal.
Drawing sets

Always the current sheet, and a warning when it isn't

  • Upload a set as one PDF. PSM reads each title block and proposes the sheet number, title and revision for every page. You check the table and publish.
  • Current sheets list every sheet at its latest revision across all sets. A newer set supersedes older sheets, which are kept and stamped "Superseded", never deleted.
  • Sheet history shows every revision, and any two can be compared side by side with linked zoom.
  • From the map, tap a skid or run to open its sheets at the current revision. If the work was built to an older revision, PSM says so.
RFIs

Questions asked from the field, answered on the record

  • Ask an RFI from the map. The location, the sheets that cover it and photos go in automatically. Field techs draft, and leads and Site Managers send.
  • Numbered on send (RFI-0001), with priority, discipline, cost and schedule impact, a suggested answer, the people it's waiting on, and a due date (7 days by default).
  • Answers in one thread. One is marked official, and the ball goes back to the person who asked.
  • Outside engineers get the RFI by email with its number and a PDF. Their reply is entered against it.
  • Start a change order from a closed RFI with cost or schedule impact, already filled in.
  • The RFI log filters by status, who it's waiting on, overdue, discipline and block, and exports to CSV and PDF. Open RFIs show as pins on the map: amber open, green answered, grey closed.
Submittals

A submittal register that tells you what's late before it's late

  • Import the register from Excel: spec section, title, type, supplier, need-on-site date and lead time.
  • Review chains with as many reviewers as you need, in order. Each one acts with a code: Approved, Approved as noted, Revise and resubmit, Rejected, or For record, with notes and a marked-up file.
  • Resubmittals keep the same number with the next revision and restart the review.
  • Submit-by dates worked back from need on site, lead time and review time. Late items are flagged in the log and in each person's to-do list.
  • Approved files go straight into Documents under their spec section.
  • The owner can review as one of the steps.
Change orders

Scope and cost changes with approvals that stick

  • Line items with quantity, unit and rate. Totals are calculated to the cent, along with schedule days.
  • Reasons (owner, design, field, RFI) and links to the RFIs behind them.
  • Ordered approvals, including the owner's sign-off, made with a tap that records name and time.
  • The CO log shows approved, pending and rejected totals and days to date, as CSV and PDF.
  • Money stays private. Field techs never see change orders.
Meeting minutes

Minutes that carry their open items forward

  • Meeting series such as weekly progress or safety, each with its own attendee list and numbering (WPM-012).
  • Every open action item carries forward into the next meeting automatically, marked with where it came from.
  • Typed live on a phone or laptop, saved as you go, even offline.
  • Publish locks the minutes, builds the PDF and emails it to the attendees. Later corrections are logged as revisions.
  • Action items land in the owner's Daily Scope and to-do list, and closing them there closes them in the minutes.

Waiting on you

One list at the top of the Project panel and in every Daily Scope: each RFI, submittal step, change order approval and action item waiting on you, overdue first, with a count on the header bell and phone notifications when the ball lands in your court. One search box covers files, RFIs, submittals, change orders and meeting items. The daily report and the owner view pick up RFIs sent and answered, submittals acted on, approved change orders and the latest minutes.

Security your IT team can sign off on

Every company's data is walled off from every other company's. Access is set by organization, site and level, and enforced by the database's security rules on every single read and write, not just by the screens.

Organizations, sites, levels

Eight access levels, from field tech to org admin

  • Organizations are fully sealed. Nobody in one company can see another company's sites, people, photos, files, time, scans or money, at any level.
  • Sites: org admins and org managers see every site in their org. Everyone else sees only the sites on their record.
  • Levels: Org Admin, Org Manager, Asset Owner, Asset Manager, Field Manager and Field Technician, plus two platform levels for IT support. People can only grant levels below their own, and only on sites they have.
  • Reports-to and approver set per person, and they drive time approvals, PTO and approval chains.
  • Deactivate someone and they're signed out of everything at once, with their history kept. Every change to people, orgs and sites is written to an audit log.
Sign-in and branding

Strong sign-in, with your company's name on it

  • Authenticator app verification the first time someone signs in. After that, access is tied to their device's passkey, so there's no password to steal or share.
  • Your logo and banner. Org admins upload them, and they brand the org's site maps, daily reports and documents.
  • Visitors sign in with nothing. The gate QR check-in needs no account and sees nothing beyond its own form.
  • Hosted on Google Cloud through Firebase, encrypted in transit and at rest, with your data exportable at any time.

Priced to cost less than what you use now

You pay for the size of the site, never per person. Bring the whole crew, your subs, your inspectors and the owner at no extra cost. On most sites PSM costs less than the per-seat apps it replaces, and switching costs nothing.

PlanPhaseWhat's includedPriceMinimum
PSM FieldBuildSite map and POD, Emergency and SOS, lightning, heat and wind alerts, permits and JHAs, hazard pins, photo evidence and naming, inspections and punch list, daily report, time clock$10per MWac per month$750 / month
PSM ProjectBuildEverything in Field, plus the document library with versions, drawing sets, RFIs, submittals, change orders, meeting minutes and the owner view$18per MWac per month$1,500 / month
PSM OpsOperateEmergency and SOS, weather alerts, permits and JHAs, hazard pins, plus PMs and Daily Scope with PPE, inspections and punch list, tools and calibration, visitor check-in, time clock, daily report$75per MWac per year$4,000 / year
PSM Ops + SCADAOperateEverything in Ops, plus live production, health and alerts, and the owner dashboard$100per MWac per year$6,000 / year
PSM Ops + SCADA + SolarEyeOperateEverything in Ops + SCADA, plus SolarEye thermal inspections on the map, with one scan analysis a year included$120per MWac per year$7,500 / year

Unlimited users on every plan. Per-seat field and safety apps publish prices of $24 to $89 per user per month. A 200-person crew at the lowest of those rates costs $57,600 a year. PSM Field for a 100 MWac build costs $12,000.

One IR scan costs more than a year of PSM. Full-service aerial thermography runs $120 to $280 per MWp for each visit, so on any site over 50 MWac a single outside scan costs more than a year of Ops + SCADA + SolarEye, which includes one scan analysis a year. SolarEye is optional: every plan works fully without it, and you can add it at any time. Flight options are below.

No setup fee on annual terms. We load your drawings, KMZ, equipment and photo list at no charge. Month-to-month sites pay $5,000 for a build site or $2,500 for an operating site.

We cover the overlap. Still under contract with the tool you're replacing? We credit up to six months of PSM to match the months you have left.

Built on PSM, operated on PSM. At COD a build site moves to Ops with its data intact, and the first six months of Ops are free.

Your price is locked for three years. Portfolio discounts are 15% off at 3 to 5 sites and 25% off at 6 or more.

SolarEye flights

OptionHow it worksPriceTerms
Your pilotYou fly a radiometric thermal drone and upload the flight. SolarEye processes it, maps every finding and compares it with the last scan.$25per MWdc per scanOne scan a year included on Ops + SCADA + SolarEye. Available on any Ops plan
PSM flight crewOur Part 107 pilot flies the site with a radiometric thermal drone. Flight and analysis included.$60per MWdc per visit$3,000 minimum. $35 per MWdc for the scan included with Ops + SCADA + SolarEye. Travel beyond 300 miles of Zachary, LA at cost
Your dockConnect a DJI Dock you own. Scheduled and on-demand flights process and publish to the map automatically.$400per dock per monthUnlimited dock scans. Month-to-month
PSM DockWe supply, install and run a DJI Dock 3 with a Matrice 4TD: hardware, installation, FAA waiver, flight software, maintenance, remote operations and every scan it flies.$2,500per dock per month36-month term. No hardware to buy. Dock count set in a free site survey

Monthly thermal for less than quarterly outside scans. Four outside scans a year of a 130 MWdc site run about $78,000 at the low end of market rates. A PSM Dock on the same site costs $30,000 a year and flies as often as you schedule it, including right after a storm.

No capital to approve. Buying a dock system outright runs $26,000 to $54,000 in hardware before installation, flight software, authorization and upkeep. PSM Dock turns that into one monthly line in the O&M budget.

Price my site

Build plans bill monthly until COD.

Per site, per month
$1,000

Annual terms, no setup fee. Per-seat comparison uses $24 per user per month, the lowest published rate among common field apps. The IR comparison uses the low end of published full-service thermography rates, at 1.3 MWdc per MWac. Estimate only; your quote confirms the final number.

Questions

Is there really no per-user charge?

None. A 200-person crew costs the same as a 20-person crew on the same site. Add subs, inspectors and the owner whenever you like.

Does it work without cell service?

Yes. Ticks, photos, inspections and clock punches save on the phone and send themselves when the signal comes back. The app shows what hasn't sent yet.

Do we have to give up Procore or SharePoint?

No. PSM never writes to another system. Keep your existing tools and link their documents to the map, or run documents, drawing sets, RFIs, submittals, change orders and minutes in PSM itself.

How long does setup take?

A typical site is loaded from its drawings, KMZ and equipment list within two weeks. Your crew can start the day it's live.

Does PSM replace our safety program?

No. It puts your program in front of the crew: your emergency numbers, muster points, permits and JHAs, and live weather limits. Your emergency action plan, competent persons and stop-work authority stay in charge. If a weather feed is down, PSM says so and tells the crew to stop work if they hear thunder.

Who owns the data?

You do. Export it to CSV and PDF at any time, including after you stop using PSM.

Where is it hosted, and who can see what?

PSM runs on Google Cloud through Firebase. Every person signs in, and roles decide what they can see and change. Owners get a read-only view.

Can we try it before we commit?

Yes. We run paid pilots of 60 to 90 days with success criteria agreed up front, and the pilot fee counts toward your contract if you sign. If you're under contract with another tool, we credit up to six months of PSM so you never pay twice.

Who's behind PSM?

PSM is built and supported by The Technomancer LLC in Zachary, Louisiana. The product was designed on a live utility-scale build by people with journeyman electrical, commercial and industrial, and post-COD plant management experience.

See your own site in PSM

Send us your site size and phase. In 25 minutes we'll walk through the map, live production, the safety tools and a crew member's day, set up the way your site works.

Salessales@thetechnomancerservices.com
Supportsupport@thetechnomancerservices.com
Phone859-612-1661